Skip to content
The PURE Report Oncology
The PURE Report: Oncology 2022
Our 4th wave of syndicated Oncology report with insightful and actionable findings of oncology practice needs including rankings of up to 24 manufacturers.
The PURE Report Neurology
The PURE Report: Neurology 2022
Completed its third wave of syndicated research with cross-therapeutic area comparisons including benchmarking of 26 different support programs.
Doctor Checking Child Patient
The PURE Report: Immunology 2022
Launched in 2022 with insights from programs working with dermatology, rheumatology, and gastroenterology offices.
The PURE Report Patient
The PURE Report: Patient 2022
Provides the patient view and their needs from the pharma support programs across therapeutic areas like oncology, neurology, and immunology.

The PURE Report consists of two separate reports: a syndicated research plus a separate report with company specific insights

Book Icon Orange

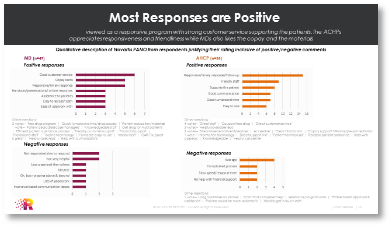
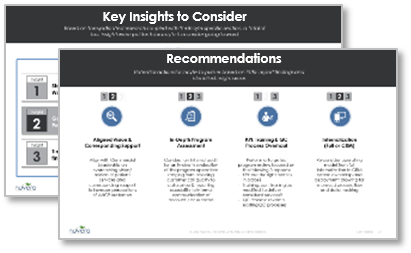
PART I: Customer Perception

Key insights into customer needs, expectations, perceptions, and best-in-class manufacturer mentions

Product Right Book

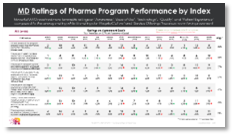
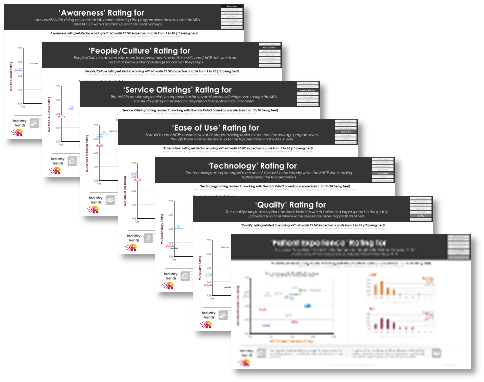
PART II: Industry Benchmarking

Manufacturer scores and rankings across 7 key indices with a spotlight on individual manufacturer

Part I: View into Syndicated Report

The comprehensive syndicated patient services report analyzes and interprets results from 400 respondents that provides key insights into customer needs, expectations, perceptions, and best-in-class manufacturer mentions.

Sample Finding #1 HCP Go-To Partner for Reimbursement Support

Pharmacy Benefits

(oral/self-injectable)

Pharma Company Program
0%
In-house Pharmacy
0%

Medical Benefits

(buy & bill)

Pharma Company Program
0%
In-house Pharmacy
0%
0%

Hospital Centers are 20% more likely to partner with in-house pharmacies on pharmacy benefits

Sample Finding #2 HCP Communication Preferences on Patient Updates

Email
0%
Web Portal
0%
Phone
0%
Fax
0%
Face to Face
0%

Sample Finding #3 HCP Program Awareness

How HCPs Learn About Patient Support Programs

Part II: View Into Company-Specific Insights

The company-dedicated section of the PURE Report addresses company-specific feedback from respondents in the form of unaided free-text feedback as well as numeric rankings in relation to other top-performing programs within the therapeutic area.

01.

Industry Dashboard

Individual company scoring across the 7 PURE Report indices highlighting best/worst performers

02.

Company Analysis

Company rating along the 7 PURE indices and ranking compared to competitors

03.

Unaided Feedback

Unaided open-text feedback about company’s support program

04.

Considerations

Company feedback analyzed and potential actions proposed based on survey result
PURE Industry Grid
PURE Scores for Company
PURE Feedback on Company
PURE Recommendations for Company

Who We Spoke With

The screener and background participant information was carefully crafted to ensure participant familiarity with the space, sample representation of industry population, and segmentation and detection of trends that support programs can act on. For example, research participants are:

  • Based on role, not title: Participants selected based on their day-to-day activities
  • 150 MDs and 350 support staff: Total sample size per therapeutic area reaches 500 participants to ensure statistically significant insights (total sample size exceed 1,400 HCPs to date)
  • Geographically diverse: Participants proportionally represented based on geographic location
  • Split between hospital systems and community practice: Proportional mix of stakeholders from various provider channels based on therapeutic area
  • Representative of various practice sizes and dispense capabilities: Appropriate mix of large, medium, and smaller providers with differing outpatient pharmacy capabilities